Gold’s Grit: Market Jitters, Aussie Equities, and Bellevue’s Brutal Week
August 4, 2025Gold prices rose in both the U.S. and Australia over the past week. In the U.S., gold gained 0.98%, closing at US$3,348.815 per ounce on Friday. In Australia, it rose 1.84%, ending the week at AU$5,181.071 per ounce.
The week began with gold falling to a three-week low. President Trump and the European Union agreed on a 15% tariff on EU goods, the rate being half of what the Trump administration initially threatened to impose. As a result, fears of a broader trade war eased.
On Tuesday, gold prices rose as investors waited for the outcome of U.S.-China trade talks and the Federal Reserve's policy meeting. While recent U.S. deals with the EU and Japan offered some relief, the talks with China remained complex and dragged on.
The US Federal Reserve closed its meeting on Wednesday, announcing it would hold the Federal Funds Rate steady, as expected. This led to the US Dollar Index rising and caused investors to pull funds out of gold, falling to as low as US$3,269.
However, this decline in gold did not last. A weak jobs data and a surprise tariff announcement by President Trump on Friday caused investors to sell equities and buy gold. The U.S. dollar weakened, treasury yields dropped, and expectations for a rate cut in September increased. Gold closed at US$3,348.15 while the Nasdaq dropped 2%, the S&P 500 and Dow Jones each fell by 1.5%, and small-cap stocks fell 2.5%.
To add to the drama, President Trump fired the Commissioner of the Bureau of Labor Statistics, Dr Erika McEntarfer, as he accused her and the bureau of releasing fake job statistics. The timing of this act was somewhat awkward, although the bureau has accumulated a poor reputation for misleading and downright inaccurate reporting of economic data over decades.
The reversal in the US dollar and gold helped boost gold in Australian dollar terms by 1%. However, the Australian markets will reflect this in the coming week as all these happened after the close of trade. The materials sector was the worst performer on the ASX200, falling nearly 4% last week. Gold stocks were no exception as investors also took profits from mining equities, many of which had become overvalued after this year’s gold rally.
The ASX-All Ordinaries Gold Index fell by 418.19 points last week. It started the week flat before dropped over 400 points in two days from Wednesday:
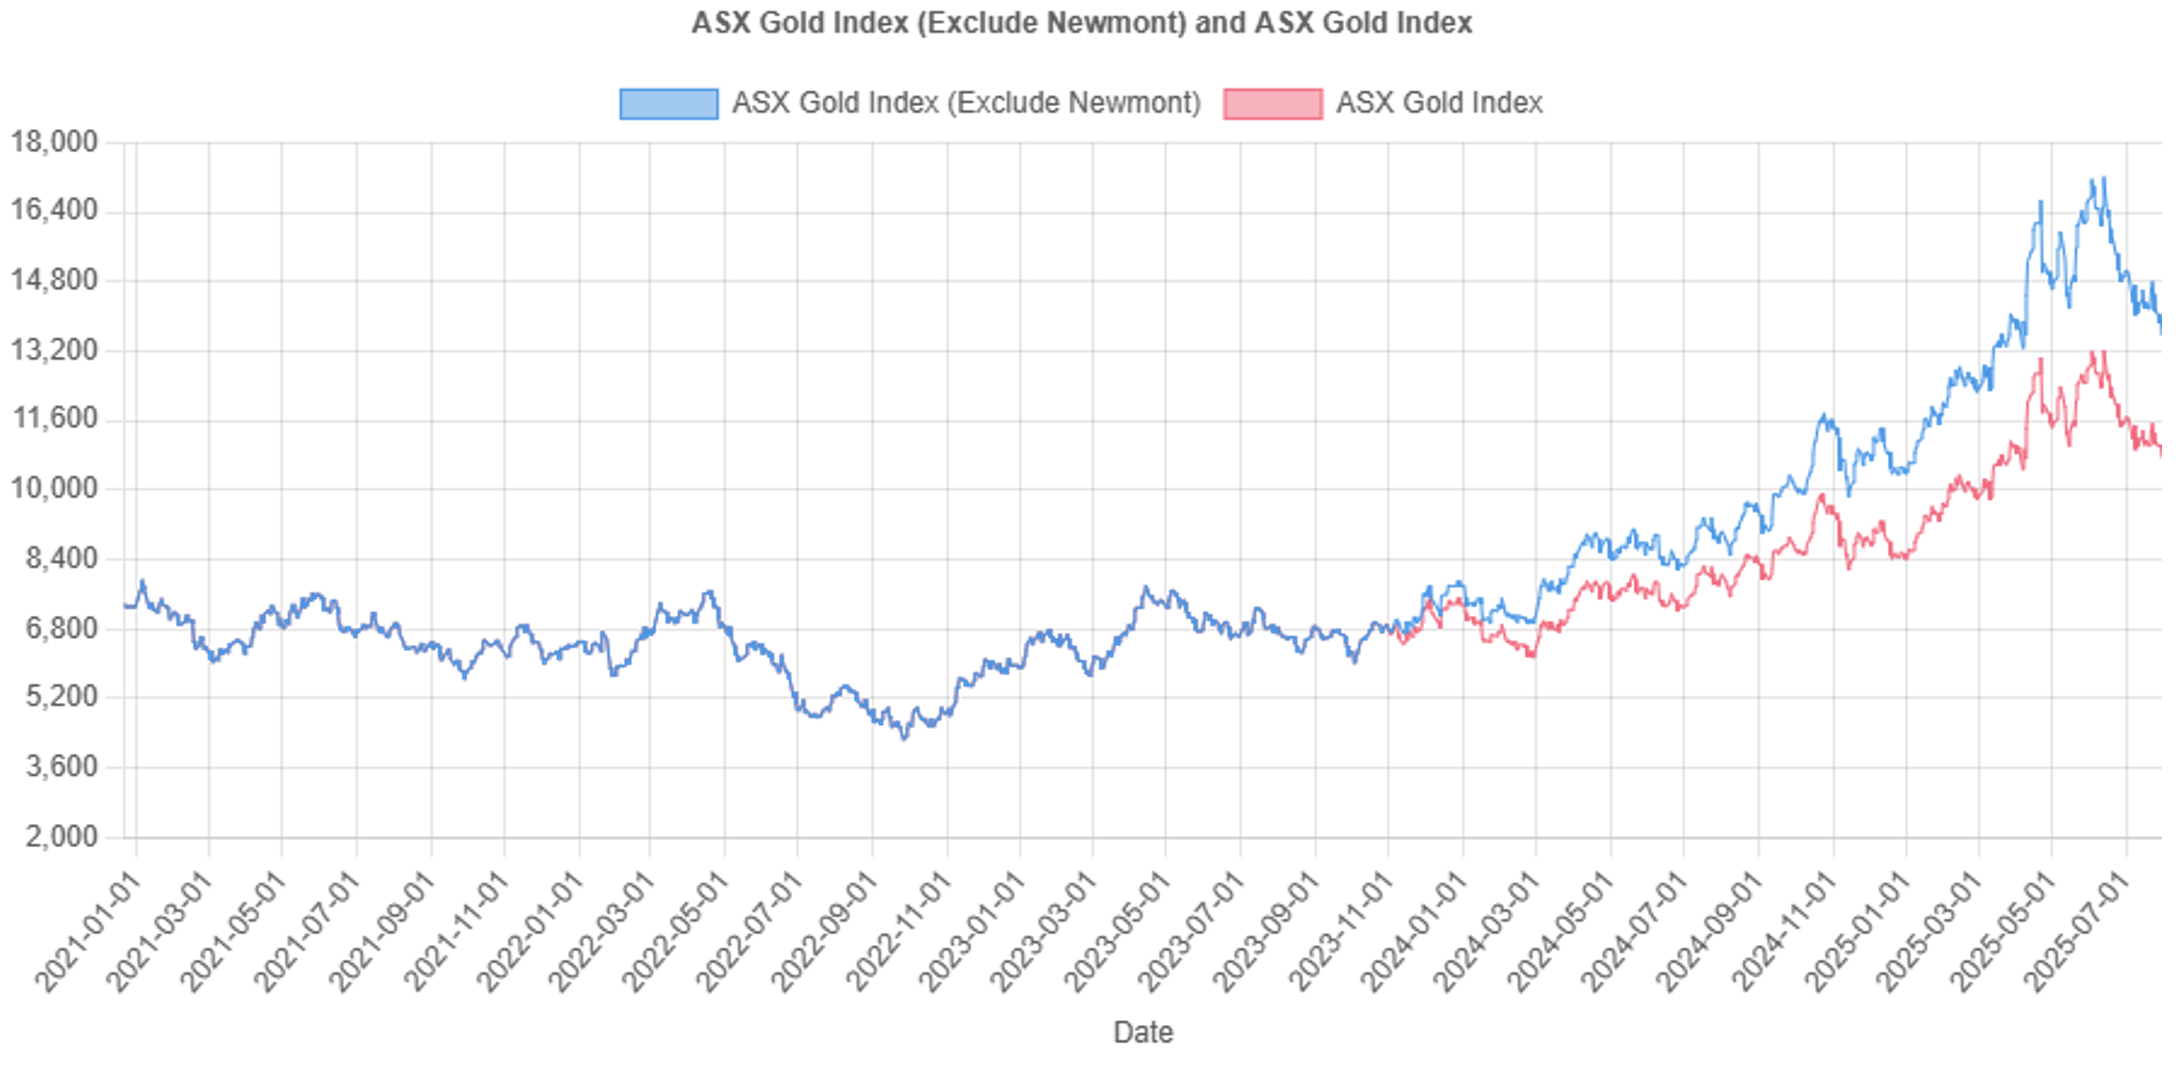
Figure 1: Movements in the ASX-All Ordinaries Gold Index (Source: GoldHub Australia)
The bright side from this selloff is that gold producers are entering the fair valuation range once again, being overvalued for around three months. The Gold Stocks Valuation Index dropped nearly 2% to 61.00% during the week. A reading between 40–60% means fair value, over 75% means overvalued, and under 25% means undervalued:
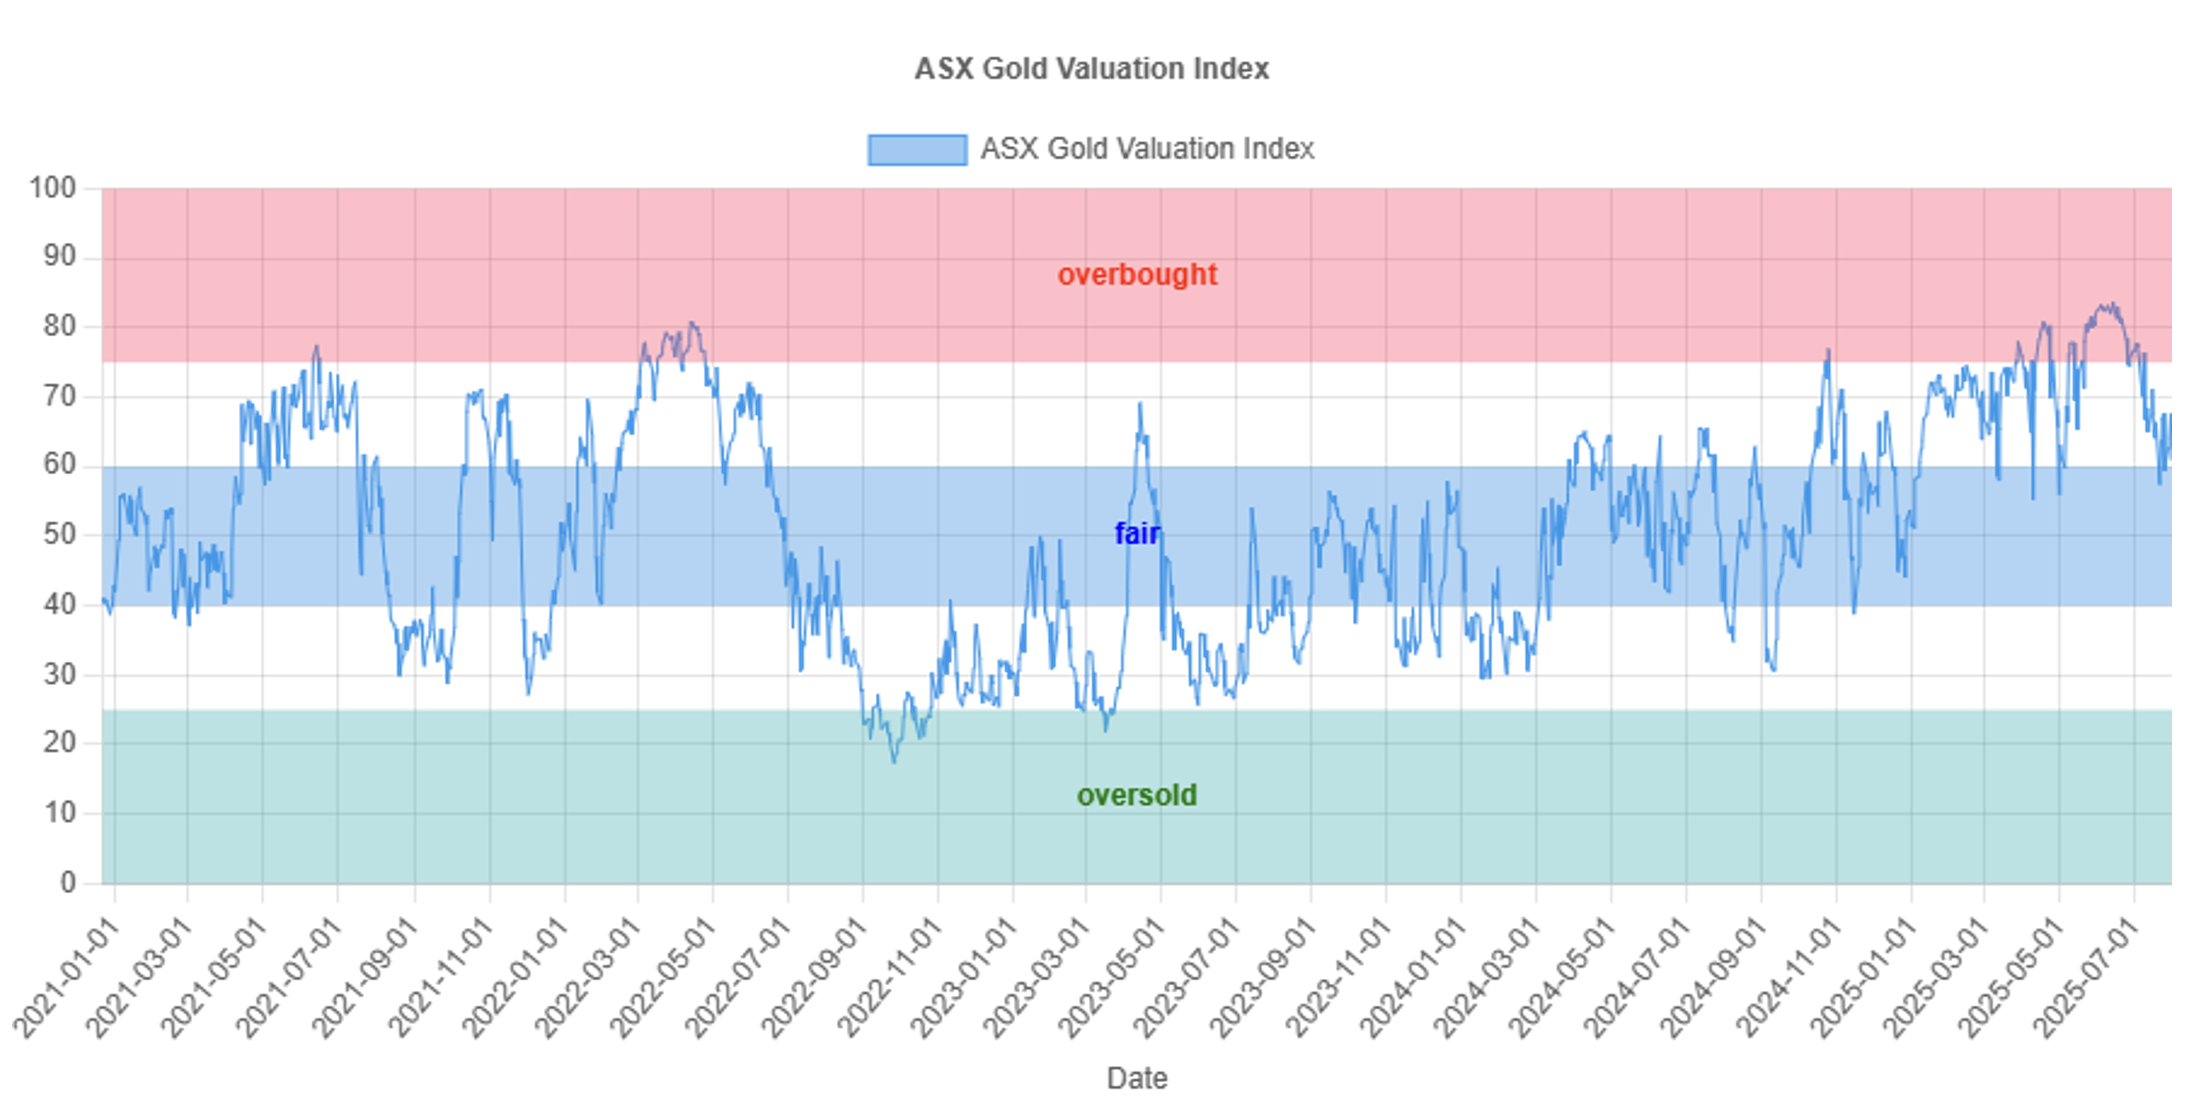
Figure 2: Movements in the ASX Gold Stocks Valuation Index (Source: GoldHub Australia)
To help you understand this index, it measures the relative value of gold producers to two of their key drivers, gold and the gold-oil ratio. The index rises if gold stocks trade higher relative to gold and the gold-oil ratio, and vice versa. The gold-oil ratio fell 3 units last week to 47.77 barrels per ounce, its lowest since late June:
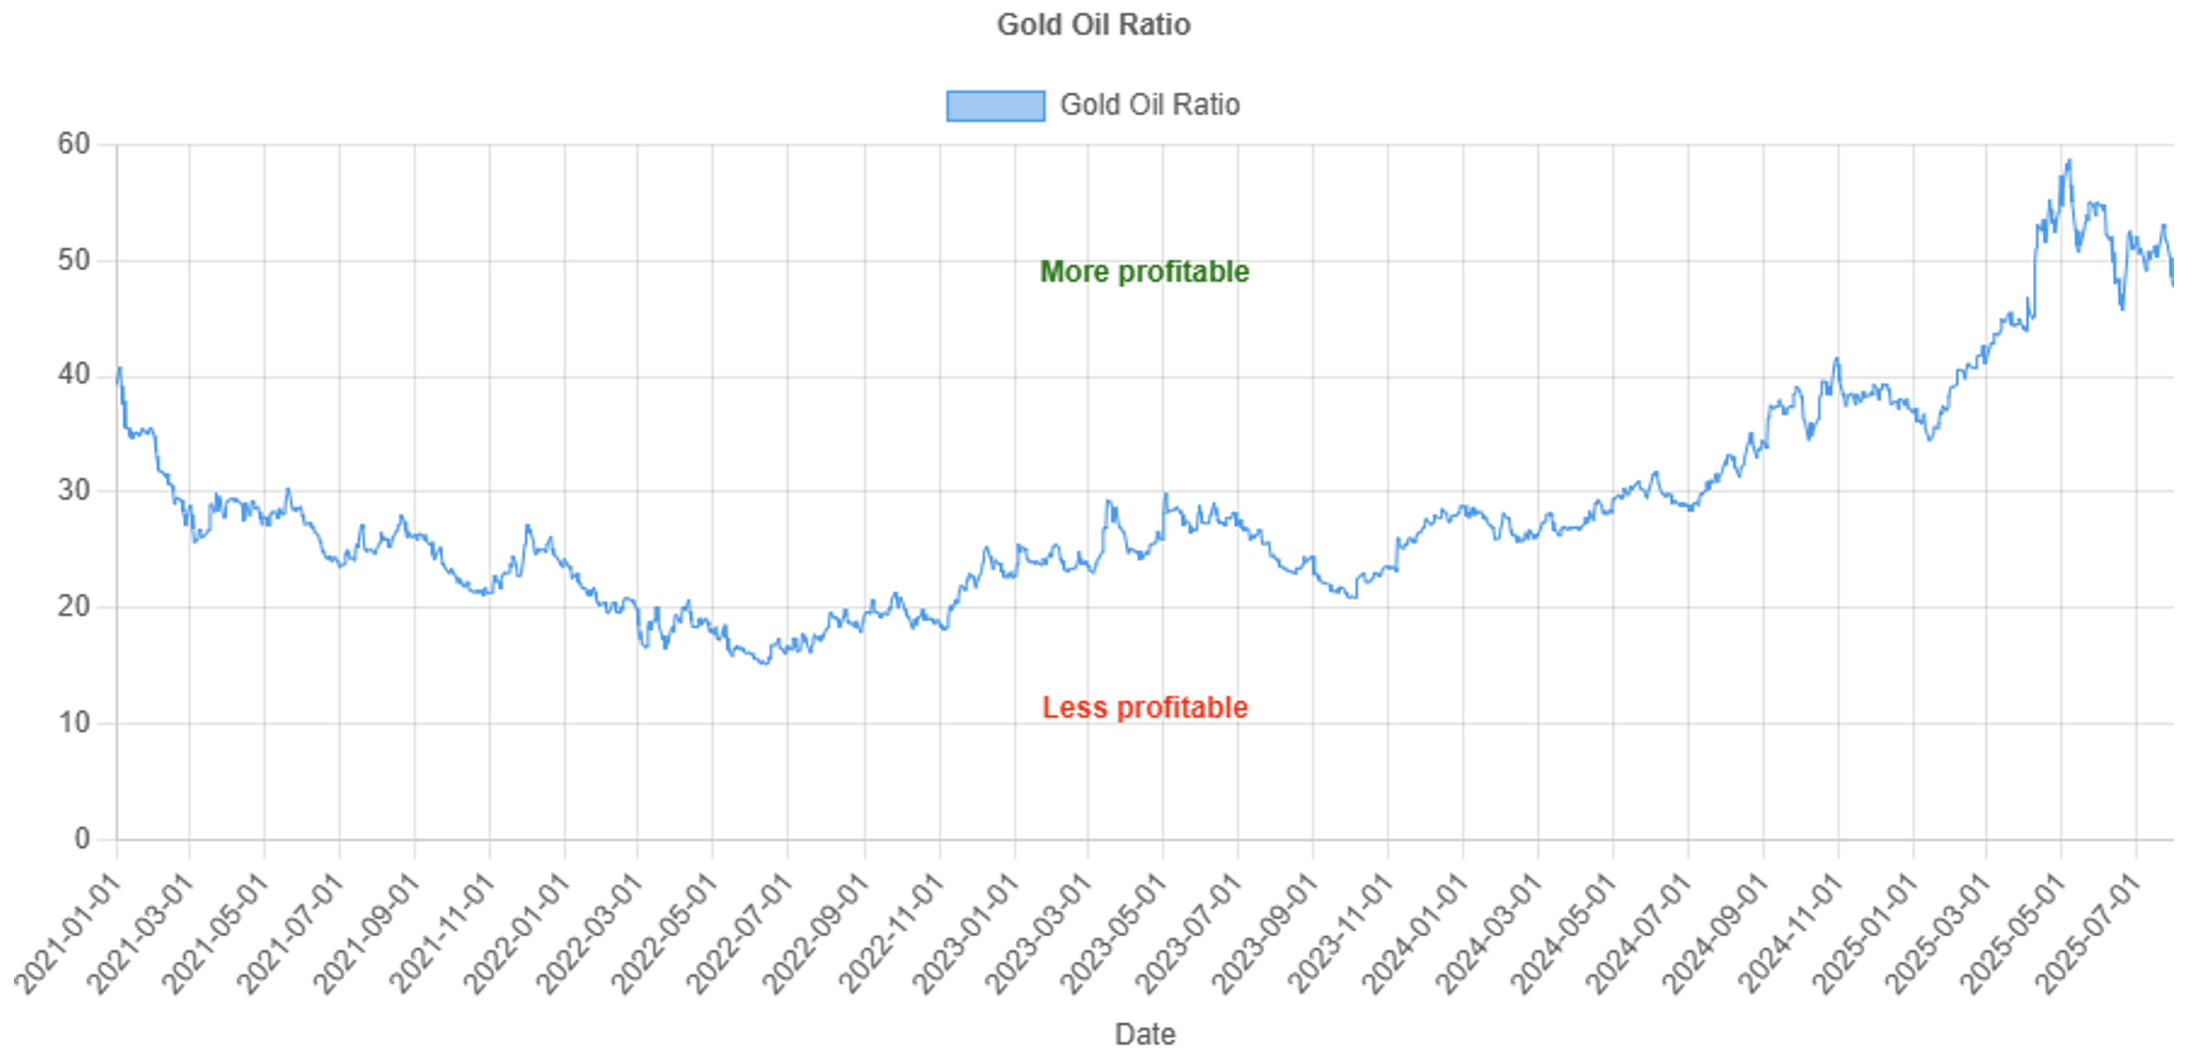
Figure 3: Gold-Oil Ratio Movements
Crude oil prices rose due to tighter supply. U.S. inventories fell by 17 million barrels in late July, one of the largest drops in years. As a result, strong summer fuel demand and limited supply may raise mining costs in Australia. Right now, gold producers are delivering record operating margins and building a significant cash pile thanks to the gold-oil ratio being much higher than its historical average. However, should oil start to rally from here and the gold-oil ratio normalise, it could cause gold stocks to correct further.
Last week’s biggest movers
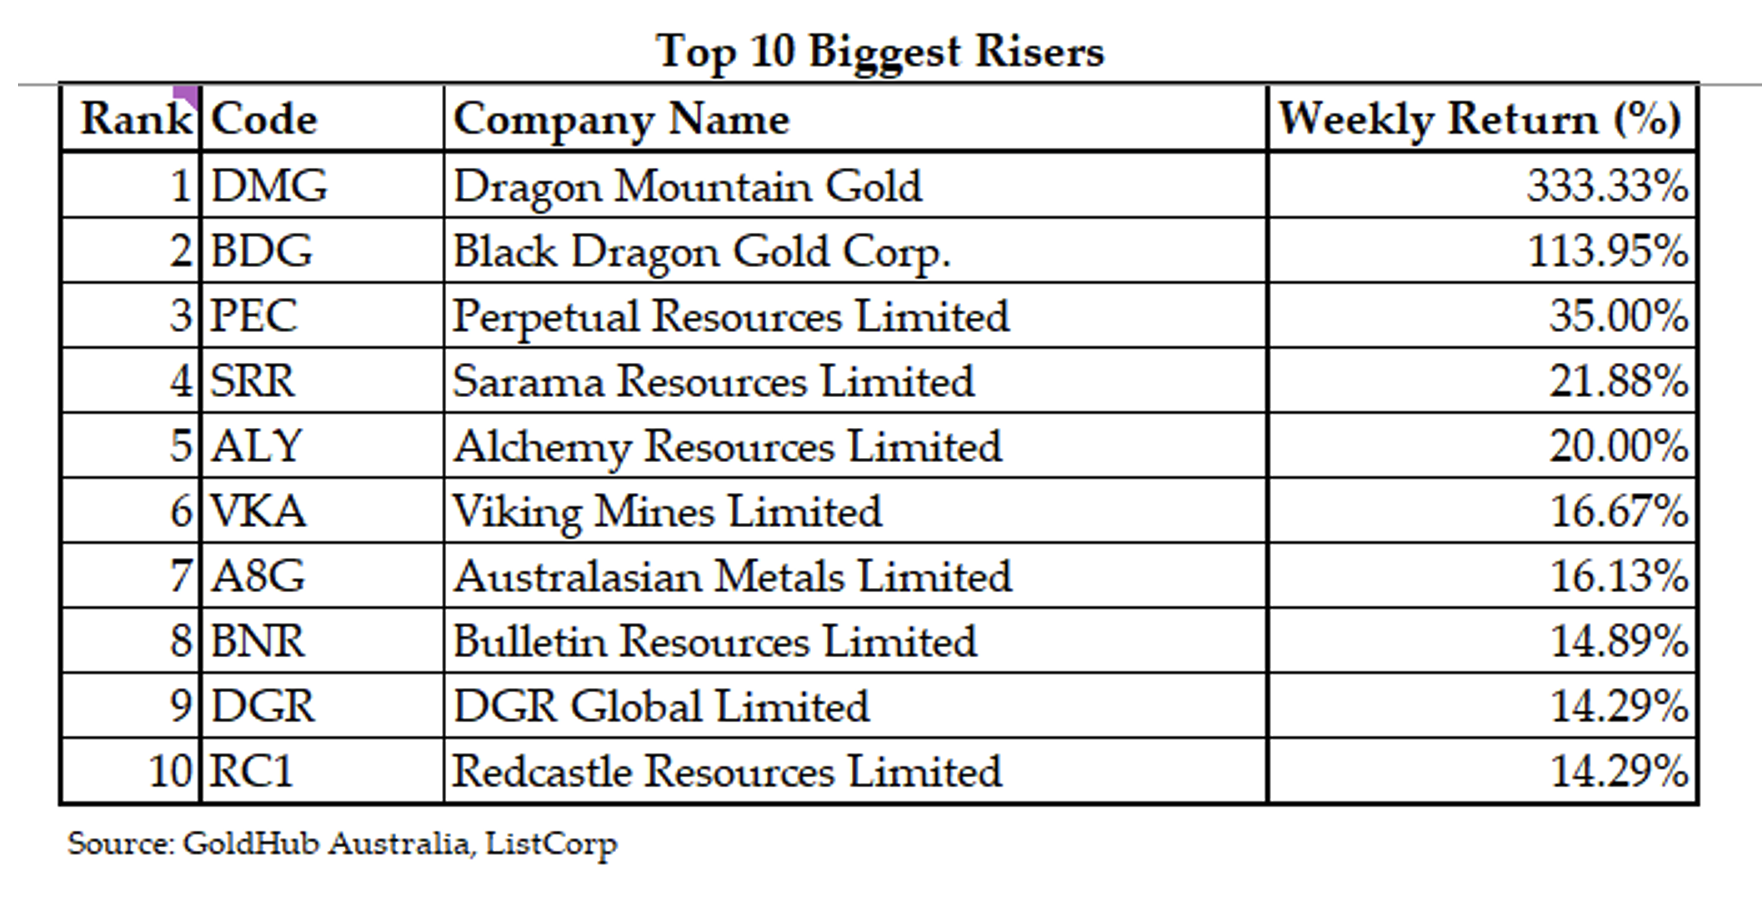
Typically, the biggest movers during the week will be the small-cap explorers owing to their size and low liquidity making them highly sensitive to price moves. Last week’s biggest riser was Dragon Mountain Gold (DMG), increasing by 333.33% during the week Black Dragon Gold (BDG) was next at 113.95%. Others on the list were explorers like Perpetual Resources (PEC), Sarama Resources (SRR), Alchemy Resources (ALY), and Redcastle Resources (RC1). Black Dragon Gold surged after giving an update on its Salave Gold Project in Spain (read more: BDG) showing progress with environmental steps and local engagement. This boosted investor confidence and attracted buying interest.
Next are the biggest decliners:
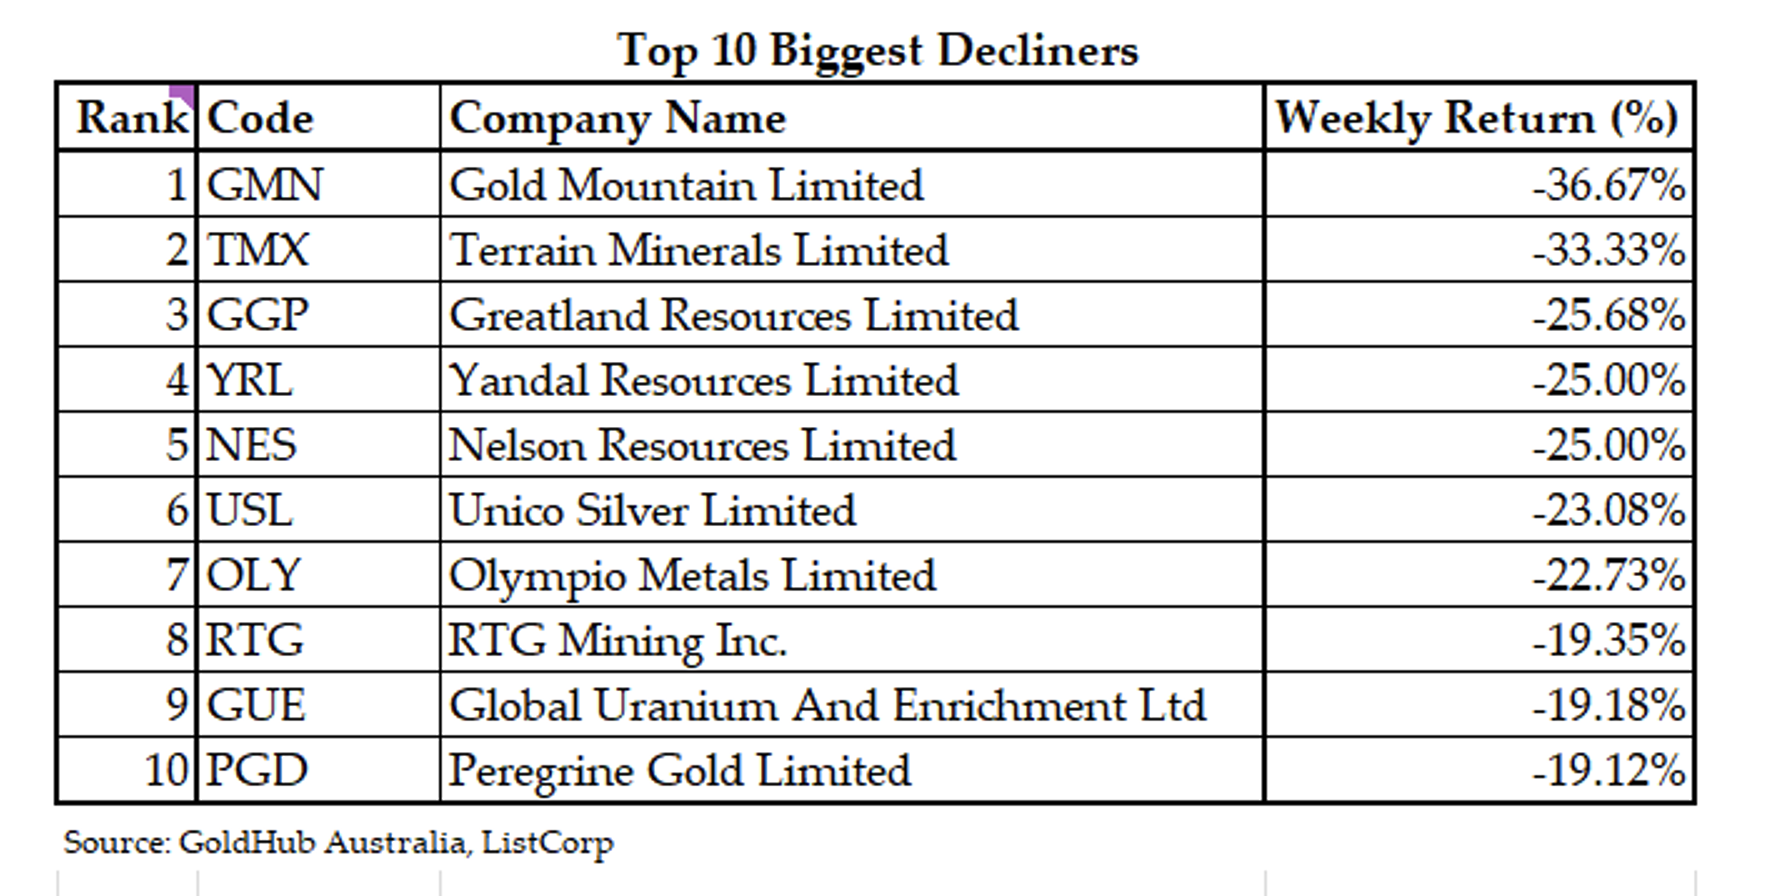
Like the biggest risers, the list comprised mostly small exploration or development companies. The biggest decliners were explorers Gold Mountain Limited (GMN), which fell 36.7% and Terrain Minerals (TMX), which dropped 33.3%. There was an exception last week, as gold producer Greatland Resources was the third biggest decliner, falling by almost 26%. It is the seventh-largest ASX gold miner by market value.
What caused Greatland Resources to decline sharply was that the company cut its production forecast from 300–340koz/year to 260–310koz/year. Analyst Hayden Bairstow said Greatland’s June quarter gold output was 13% below expectations. Capex forecasts for the Telfer and Havieron mines—$260M and $70M—were higher than expected, as was the $55–60M exploration budget.
Finally, last week’s company in focus is Bellevue Gold (BGL), whose share price dropped by nearly 5% on Friday. It was the biggest loser on the ASX200 that day. However, its trading volume ratio compared to the ASX200 is 191% higher than its 90-day average.
Bellevue Gold released two reports that caused this fall: its FY26 guidance and reserves update (read more: BGL1) and an investors site visit presentation (read more: BGL 2). In these reports, Bellevue Gold cut its production guidance to 130,000–150,000 oz, in yet another downgrade since gold production began early last year. Moreover, the company’s profitability has been disappointing despite gold doing well. The company hedged a significant amount of its gold sales at around AU$2,600-3,000 an ounce, limiting its exposure to gold’s rally. Operating costs have remained high, adding to further headaches. The company recently closed out part of its hedge contracts until the end of 2025. This led to a sharp increase in the company’s operating margin this quarter, as you can see the significant difference between the gold sale price and the all-in sustaining cost (AISC) below:
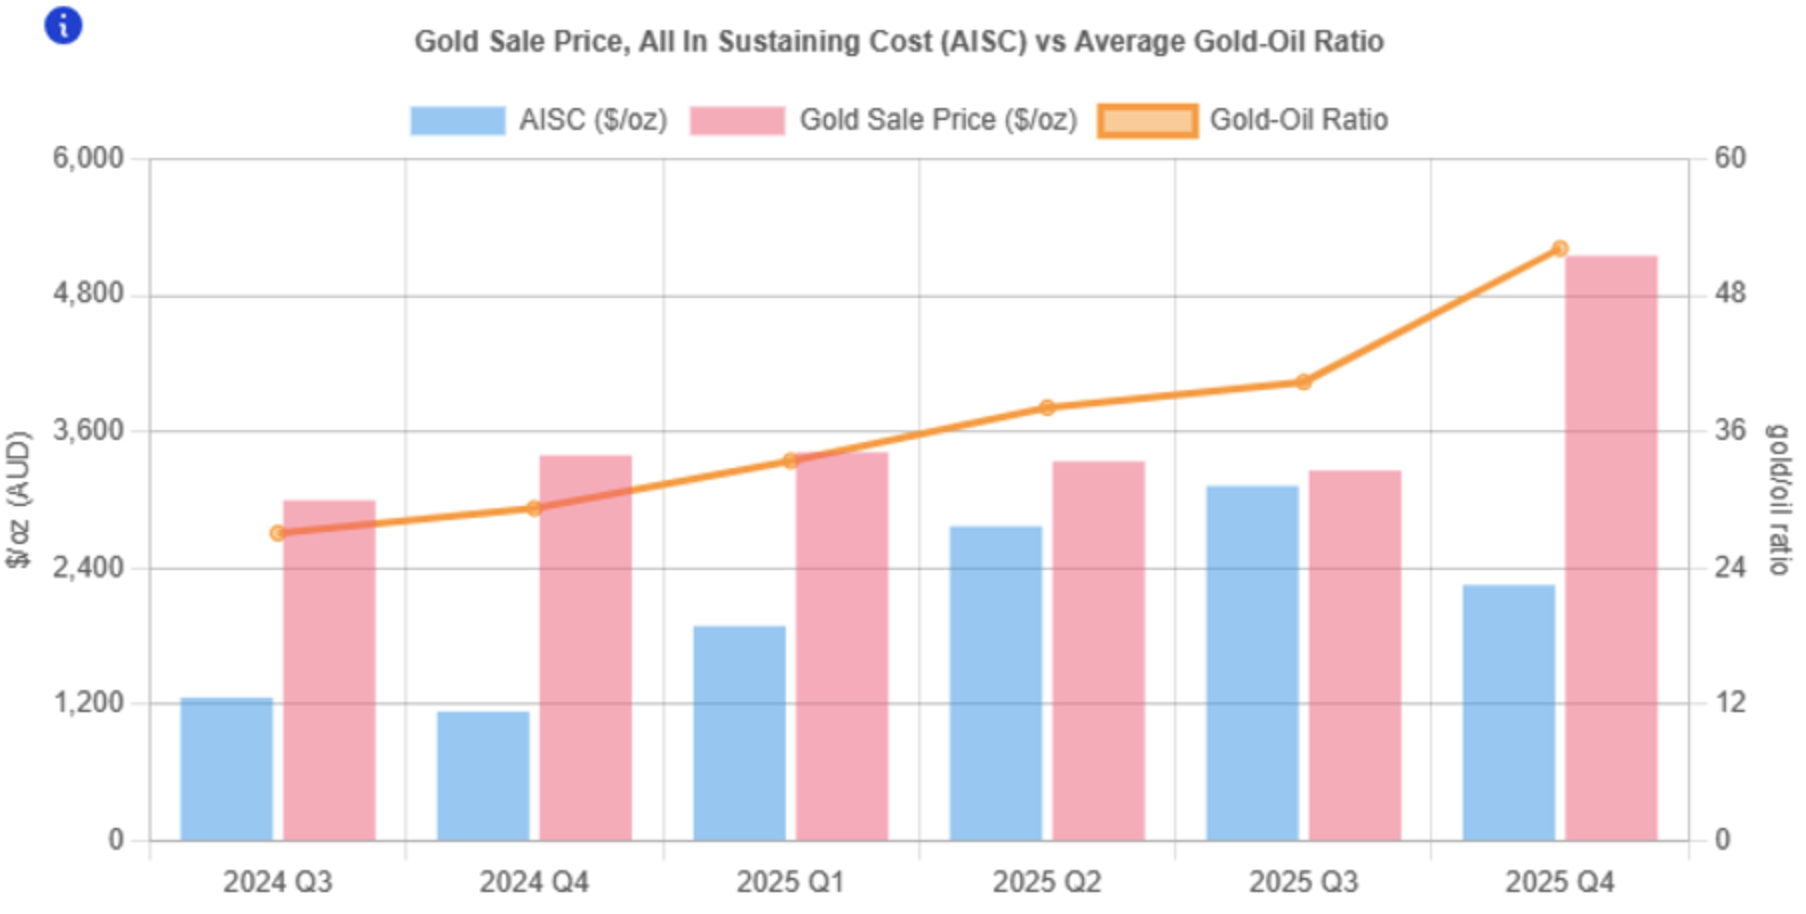
Figure 4: Bellevue Gold’s Operating Margins (Source: GoldHub Australia)
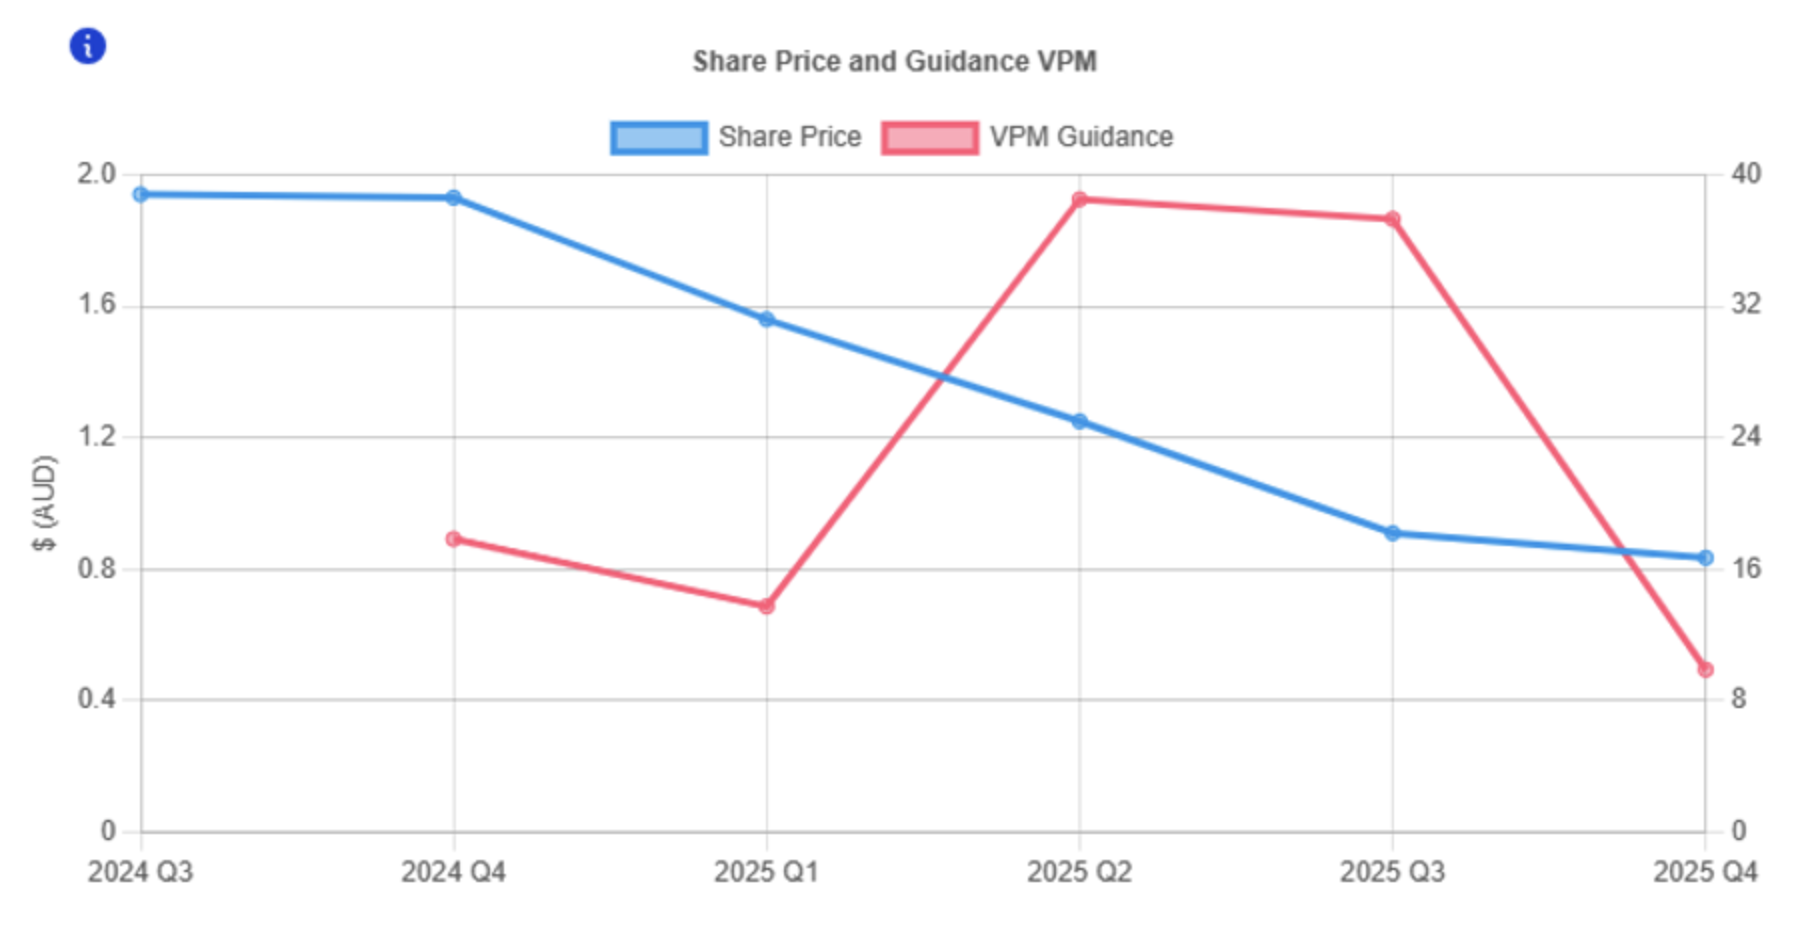
Figure 5: Bellevue’s Share Price v/s Guidance VPM (Source: GoldHub Australia)
Moreover, even though gold and the gold-oil ratio rose in 2025, Bellevue’s margins fell 40% from Q2 to Q4 2025. This happened even though the gold-oil ratio increased by 7 barrels/oz in that time. Bellevue’s guidance VPM rose 24 units during that period to 37.299, suggesting heavy overvaluation. Bellevue now trades at AU$0.78, which is 17% lower than last month and 40% below last year’s level.
For a limited time, you can use the promo code PULLBACK25 to get 50% off the first year of subscription.
Brian contributes his insights on precious metals and mining stocks via free and paid newsletters with independent publisher, Fat Tail Investment Research. You can learn about his work by visiting www.daily.fattail.com.au. Fat Tail Investment Research is part of The Agora, a renowned international financial solutions publisher.
Disclaimer: None of our content constitutes financial advice nor endorsements and recommendations for any organisations, companies, and products. Please seek a professional financial adviser before you make any decisions arising from our videos, articles and other published material. All those featured in our videos express their opinions and may not reflect our views. We support freedom of speech, thought, and expression.